
The beautiful game has undergone a data revolution. Gone are the days when simple scorelines and possession stats told the whole story. Today, football analytics reigns supreme, transforming how teams scout, train, and strategize. From grassroots leagues to the Champions League, data-driven decisions are the new normal, offering a competitive edge to those who embrace them.
This evolution demands a deeper understanding of match statistics. It’s no longer enough to track goals and assists; modern football thrives on key performance indicators (KPIs) that reveal hidden patterns and unlock actionable insights. This article will equip you to identify and utilize these KPIs, helping you move beyond basic metrics and gain a strategic advantage. The focus? Understanding the numbers and, more importantly, acting on what they reveal. In the world of football analytics, knowledge is power, and the ability to translate data into decisive action is the key to victory.
Beyond the Basics: Moving Past Simple Stats
For decades, the roar of the crowd often followed the goals and assists, the glittering prizes of athletic achievement. These traditional stats have long been the cornerstones of player and team evaluation. They are easily tracked, universally understood, and deeply ingrained in the sports narrative. However, relying solely on these metrics paints an incomplete, and sometimes misleading, picture of actual performance.
The limitations of goals and assists lie in their inability to capture the nuances of the game. They fail to account for the crucial passes that set up the assist, the tireless defensive work that prevents goals, or the tactical contributions that shift the momentum of a match. A player who consistently wins possession in midfield, disrupting the opponent’s attacks and launching their own, might register few goals or assists but is undeniably vital to their team’s success. Consider a defensive midfielder, a master of interceptions and tackles, who consistently breaks up opposition plays. Their contribution might not be reflected in the score sheet, yet their impact on the game is undeniable.
Therefore, while goals and assists remain relevant for historical records and highlight reels, they are insufficient for making informed strategic decisions. Modern analysis demands a more comprehensive approach, moving beyond these basic stats to uncover the underlying factors that drive winning performance. The future of sports analysis lies in key performance indicators that delve deeper.
The Key Performance Indicators (KPIs) That Matter
In the modern game, simply watching a football match isn’t enough to truly understand a team’s performance. Advanced Key Performance Indicators (KPIs) are now essential tools for coaches, managers, and analysts seeking a deeper understanding of the beautiful game. These metrics go beyond goals and assists, offering insights into team dynamics, player contributions, and tactical effectiveness. Harnessing these KPIs can be a game-changer, leading to enhanced decision-making and improved results on the pitch.
Possession Percentage: This KPI reflects a team’s ability to control the ball. A high Possession Percentage often indicates an aggressive, offensive-minded team that dictates the tempo of the game. Elite clubs meticulously analyze possession data to identify weaknesses in their opponent’s defensive structure and exploit those areas. For example, a team like Manchester City, known for its possession-based style, uses this metric to ensure they are dominating the midfield and creating consistent attacking opportunities.
Passing Accuracy Rate: This KPI measures the percentage of successful passes a team completes. A high Passing Accuracy Rate demonstrates a team’s proficiency in executing the manager’s tactical vision. It reveals whether players can maintain possession under pressure and effectively distribute the ball to create scoring chances. Premier League teams use passing accuracy data to assess their midfielders’ ability to control the flow of the game and maintain offensive momentum.
Tackle Success Rate: A critical indicator of defensive solidity, Tackle Success Rate reflects the percentage of tackles a team’s players win. A high rate signifies a team’s ability to effectively dispossess opponents and prevent them from advancing into dangerous areas. Teams known for their strong defensive performances, such as Atletico Madrid, closely monitor this KPI to ensure their players are consistently winning challenges and protecting their goal.
Interceptions per Game: This KPI tracks the average number of interceptions a team makes per match. Interceptions disrupt the opponent’s attacks and create opportunities for quick counter-attacks. It highlights a team’s awareness, anticipation, and ability to read the game. Coaches use this data to identify players who excel at winning the ball back and turning defense into offense.
Shots on Target per Game: Focusing on attacking efficiency, this KPI measures the average number of shots a team directs on target per match. A high rate indicates a team’s ability to create clear scoring opportunities and test the opponent’s goalkeeper. Teams analyze this KPI to ensure they are not only generating shots but also creating high-quality chances that are likely to result in goals.
Expected Goals (xG): xG quantifies the quality of a scoring chance by assigning a probability to each shot based on factors like shot angle, distance, and assist type. This KPI provides a more accurate assessment of a team’s attacking performance than simply counting goals scored. It helps coaches identify if their team is creating enough high-quality chances and if their players are converting those chances at an expected rate. An xG significantly helps decision making.
Expected Assists (xA): This metric complements xG by measuring the probability that a pass will become an assist, based on similar factors. Expected Assists (xA) help evaluate a player’s playmaking ability and contribution to creating scoring opportunities for teammates. Coaches use this data to identify players who consistently create high-quality chances for others and to fine-tune their attacking strategies
Data Providers KPIs
Several platforms provide advanced player ratings based on complex algorithms, including Sofascore, WhoScored, and FotMob. These ratings offer summarized insights into individual player performances, leveraging vast datasets and statistical models. These algorithms often incorporate hundreds of data points, weighting them according to their impact on the game. While each platform uses a proprietary algorithm, they generally consider factors such as goals, assists, passes, tackles, interceptions, and key passes. These are the most renowned ratings algorithms
Sofascore is based on a comprehensive live score service, Sofascore’s player ratings are updated in real-time, reflecting a player’s performance as the match unfolds. They tend to reward players who make significant contributions in both attack and defense. Sofascore ratings stand out for their responsiveness to live game events, offering an up-to-the-minute assessment of player impact.
WhoScored uses a statistically-driven system, WhoScored focuses on a wide array of statistical metrics to generate their ratings. They consider both quantity and quality of actions, penalizing players for unsuccessful passes or missed tackles. WhoScored ratings are known for their emphasis on detailed statistical performance, often highlighting players who consistently perform well across multiple metrics.
FotMob combines statistical data with contextual information, FotMob’s player ratings integrate statistical data with contextual elements, such as the importance of a player’s actions in key moments of the game. FotMob seeks to provide a balanced assessment of player performance that considers both data and game context by combining data with outside information. It seeks to provide a more balanced assessment of player performance.
While these ratings algorithms provide valuable insights, they are not without limitations. Accurately grading a player is not easy and these are not perfect. No algorithm can fully capture the nuances of a player’s impact on the game, such as their leadership, tactical awareness, or ability to motivate teammates. However, they are the most accurate ways to grade a player using artifical intelligence.
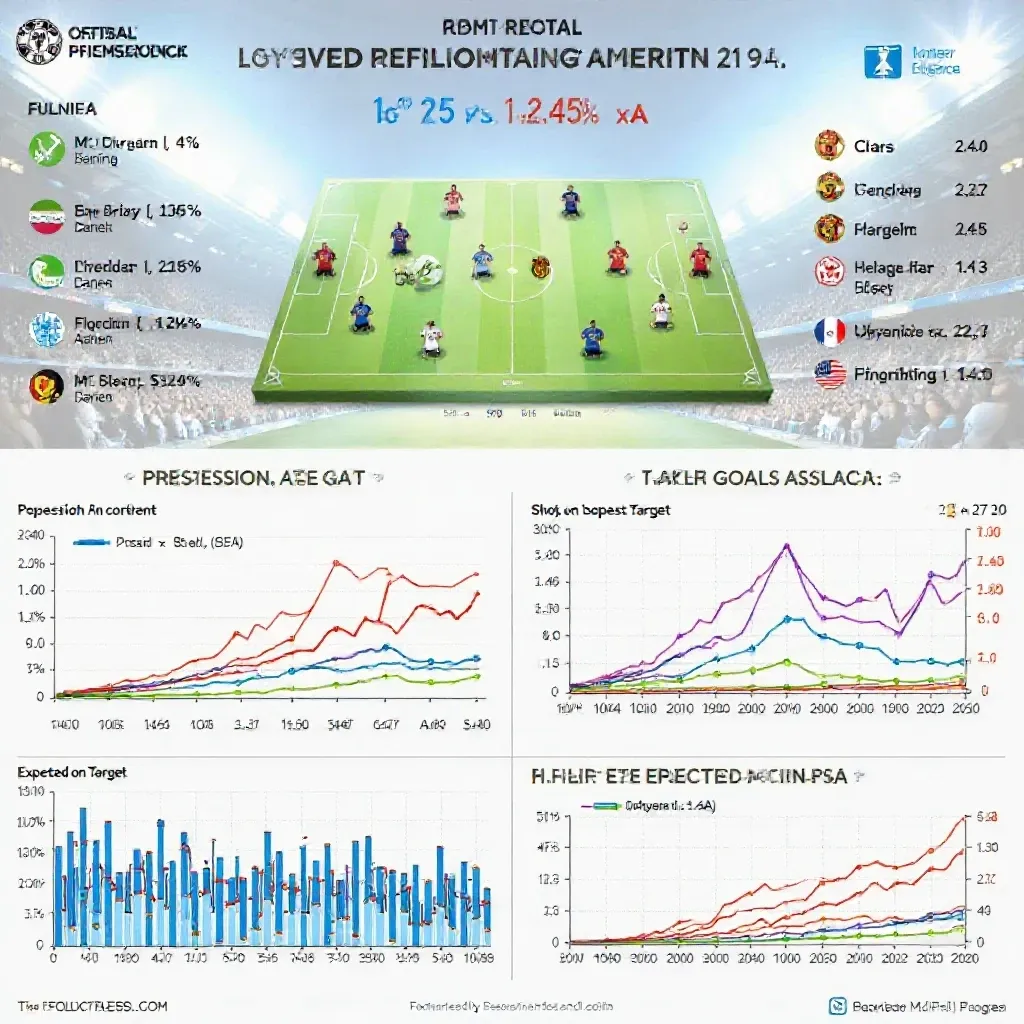
Tools for Effective Data Tracking
In the world of football analysis, several powerful data providers equip analysts, coaches, and fans with the tools they need to dissect the game. These providers collect, analyze, and distribute vast amounts of data, offering different perspectives and analytical capabilities.
Opta stands as one of the pioneers in football data. They have a long history of collecting and distributing detailed match statistics. Opta’s data is known for its breadth and accuracy, making it a staple for media outlets, leagues, and clubs worldwide. Their comprehensive data feeds cover everything from basic stats like passes and shots to more advanced metrics, solidifying their position as a leading data provider.
StatsBomb has made a significant impact with its focus on event data. They emphasize the context and outcome of actions on the field. StatsBomb data includes metrics like expected goals (xG) and possession value, offering deeper insights into player and team performance. Their approach has helped to move the industry towards more sophisticated methods of analysis.
Wyscout is valued for its extensive video database integrated with data. This platform provides a comprehensive resource for scouting, player evaluation, and opposition analysis. With Wyscout, users can access match footage, search for specific events, and generate reports, streamlining the process of identifying talent and developing game plans.
Beyond these major players, other data providers like Second Spectrum (now part of Genius Sports) and smaller, specialized firms contribute to the rich ecosystem of football analytics. Each provider brings its unique strengths, whether it’s cutting-edge tracking technology, specialized analytical models, or a focus on specific leagues or regions. This diversity of tools and perspectives empowers users to explore the game from every angle. The rise of AI and machine learning further enhances these tools, providing new and innovative ways to analyze football data and uncover hidden patterns.
Avoiding Data Overload and Misinterpretation
Diving headfirst into the world of sports analytics can feel like being tossed into a data hurricane. Numbers swirl, promising insights, but without a solid understanding of potential pitfalls, it’s easy to misinterpret the information and make flawed decisions. To navigate this landscape effectively, it’s crucial to be aware of common errors that can skew your perception of reality.
The Pitfalls of Sports Data Analysis
Sample Size Neglect
One frequent misstep is Sample Size Neglect. This occurs when decisions are based on too small of a dataset, leading to inaccurate conclusions. Imagine a football team celebrating a new player’s incredible performance after only a couple of matches. While the initial games might be impressive, a larger sample size could reveal inconsistencies or weaknesses not immediately apparent. For example, a striker might score hat tricks in two consecutive games, leading the coach to believe he’s a super scorer. However, over the next ten games, he fails to score. This highlights why relying on limited data can be misleading.
Confirmation Bias
Confirmation Bias is another trap. This involves favoring data that confirms pre-existing beliefs, while ignoring contradictory evidence. To combat this, it’s essential to challenge your assumptions and actively seek out data that might disprove your hypothesis. Even if the data go against your thinking, review, check, and re-check. The truth is more important than your opinion.
Correlation vs. Causation
The distinction between Correlation vs. Causation is critical. Just because two variables move together doesn’t mean one causes the other. Data manipulation is easy, and mistakes can happen. A classic example is linking increased ice cream sales to increased crime rates. While the two may correlate during summer months, the underlying cause is likely the weather, not the ice cream itself.
Contextual Blindness
Finally, Contextual Blindness can lead to misinterpretations. This occurs when data is analyzed without considering the surrounding circumstances. A Premier League player who dominated in a different league might struggle initially due to the increased competition and different playing styles. Failing to account for these contextual factors can lead to inaccurate evaluations.
To avoid these pitfalls, always consider the sample size, actively challenge your biases, be wary of mistaking correlation for causation, and always analyze data within the appropriate context. By doing so, you can harness the true power of sports analytics and make informed, data-driven decisions.

Putting It All Together: A Practical Example
Let’s dive into a real-world example of how data analysis can reveal fascinating insights. We’ll examine Erling Haaland’s performance, comparing his 2023/2024 season with Manchester City to his previous stint with Borussia Dortmund. This isn’t just about goals; it’s about understanding the nuances of his game and how a change of environment impacted his statistics.
Looking at the data, several key offensive metrics stand out. Haaland’s expected Goals (xG) per 90 minutes at Manchester City, according to recent stats, hovered around 1.10. During his time at Borussia Dortmund, that figure was closer to 0.95. This reveals a significant jump in the quality of chances he was getting. His expected Assists (xA) also saw a slight increase, suggesting he became more involved in build-up play.
Crucially, his shots per game also tell a story. While at Dortmund, Haaland averaged around 3.5 shots per game. At Manchester City, that number rose to over 4.0. This increased shot volume, coupled with a higher xG, paints a picture of a player thriving in a system designed to create more opportunities. The move to Manchester City placed him within a squad renowned for its creative midfielders and tactical prowess. This not only boosted his goal-scoring chances but also allowed him to refine his overall game, showcasing his evolution from a pure finisher to a more complete forward. He is in a better team, with better chances created for him and that helped him to become a better player, with better numbers. This comparison highlights the power of data to quantify a player’s evolution and the impact of their surroundings.
The Future of Football Analytics (and How to Prepare)
The landscape of football analytics is rapidly evolving, driven by technological advancements and a growing demand for data-driven insights. Staying ahead requires understanding the key trends that will shape the future of the sport. Now is the time to prepare to get the best of the incoming era to take the most advantage.
Emergent Technologies
Several emergent technologies are poised to revolutionize football analytics. These include:
AI-Driven Scouting
Artificial intelligence is transforming player scouting by automating the time-consuming task of analyzing vast amounts of player data. AI-powered scouting tools can quickly filter through thousands of players, identifying those who best fit a team’s specific needs and playing style. This reduces the scouting time to only analyze the relevant list of players, allowing teams to focus their resources on in-depth evaluations of top prospects.
Virtual Reality Training
Virtual reality (VR) is emerging as a powerful tool for player training, offering immersive simulations of game scenarios. VR training allows players to practice decision-making, refine their techniques, and improve their reaction time in a safe and controlled environment. This cutting-edge technology creates a simulated but realistic environment.
Wearable Tech Integration
Wearable technology is already making a significant impact on football, providing valuable data on athlete performance and well-being. Smartwatches, GPS trackers, and other wearable devices monitor players’ heart rate, movement patterns, and fatigue levels. This data helps coaches optimize training regimens, prevent injuries, and enhance player performance. Collecting all the biometrics is a game changer.
Fan Engagement Analytics
Fan engagement analytics is becoming increasingly important for football clubs looking to grow their fanbase and generate revenue. By analyzing fan data, teams can gain insights into fan preferences, behaviors, and demographics. This information can be used to personalize the fan experience, improve marketing campaigns, and develop new revenue streams. Leveraging fan data is crucial to keep loyalty and bring sponsors.
Conclusion
In the high-stakes arena of modern football, clinging to tradition alone is no longer a winning strategy. As we’ve explored, the beautiful game is being revolutionized by data, offering unparalleled insights into player performance, team dynamics, and strategic opportunities. Embracing data-driven decisions is no longer a luxury; it’s a necessity for clubs seeking a competitive edge.
From dissecting match stats with Expected Goals (xG) to optimizing player recruitment through comprehensive data analysis, the tools are available to transform potential into tangible results. We’ve seen how understanding possession value can refine attacking strategies and how pass network analysis can unlock vulnerabilities in opponent formations.
The journey toward data success in football is not a sprint, but a marathon. It requires a commitment to continuous learning, adaptation, and a willingness to challenge conventional wisdom. It means empowering coaches and players with actionable intelligence, fostering a culture of analytical thinking throughout the organization.
The future of football belongs to those who can harness the power of data. By implementing the metrics and strategies discussed, clubs can unlock hidden potential, optimize performance, and ultimately, achieve sustained success on and off the field. The time to embrace the data revolution is now. Start small, experiment, and refine your approach. Your competitive advantage depends on it.